
Assessment 1: Embedded task 2
I have chosen the use of imagery to synthesise my learnings across
the readings from this week.
As I reflect on in my blog update 4.1: http://hass-australian-curriclum.blogspot.com.au/2017/03/4.html,
when considering some of the key aims of the Australian Curriculum is to ensure
“that all young people in Australia should be supported to become successful
learners, confident and creative
individuals, and active and informed
citizens” (ACARA 2016), how do we (as Teachers) actually go about realising
this for students?
Reflecting on the range of digital literacies within contemporary
society; students will be faced with a vast range and multiplicity of imagery
on a daily basis (often that will be contradictory). This imagery will range
from marketing contexts, placing them in decisions around their ‘consumer
behaviour’ and ‘purchase patterns’, other imagery will be ‘political’ forcing
them to place themselves in decisions in relation to voting and contributing to
public discourse (such as discussing with friends in a social setting what they think of
the Prime Minister); to imagery related to their social beliefs and attitudes
(such as the supposed ‘ideal family’), through to making decisions in their
future workplaces. The capacity to make meaning, analyse, reflect, discern,
think critically and make informed decisions will become a ‘currency’ to their
life choices and (I believe) life outcomes.
In the context of pedagogy therefore it is incumbent on us as Teachers
to ensure that the learning experience for students is not only memorable, but
meaningful; meaning is often created when it is driven and realised from the
student and content is anchored in a real world context. The use of imagery
therefore, both assessed and created by students creates great opportunities to
do this, that are flexible and vast.
For instance, as I have shown throughout my blog posts, images can
be saved (downloaded) direct from the internet and then uploaded (such as on a
blog page) for explanatory purposes, images can be taken direct by students,
and easily shared, whether through handheld devices, such as mobile phones, or
digital cameras. An important component
of this is ensuring appropriate referencing and accreditation; I have found
when reviewing the readings and updating my blog posts (and thinking about
future teaching opportunities) the use of imagery from the: http://photosforclass.com/ is a fantastic resource, with not only global, but
Australian photographs; which are ‘creative commons’, meaning they are legal to
use and share. And within the context of my teaching area across Civics and
Citizenship, I have found and explored some great images through the ‘National Museum’
Australia’ that will make great teaching resources: http://www.nma.gov.au/exhibitions/behind_the_lines_the_years_best_cartoons_2009/leaders.
Further, I have found that one of the great features of the use of a blog is
that it accepts a range of image types (such as JPG, GIF or PIN, as shown in
the image below):

Further, besides the type; the quality and character of images can
easily be changed. The purpose and use of this is various, it can be for aesthetic
and creative reasons; but equally it can be to create different meaning, colour
reality; or, and often most perniciously, to distort or re-frame reality.
Such as these two photos.
Photo one, shows an ‘authentic’ picture of the definition of
democracy. On reading it, to me, it conjures something that is positive,
empowering and almost utopian.

Photo two (by zooming out and changing the colour to a dim and
sombre grey), to me, conjures up a different meaning. One that is perhaps
bleak; and the searching for the ‘utopian’ that is captured in the photo above,
becoming unattainable. Equally, by zooming out – you can now read the full
picture, with the inclusion of the words ……’you call this DEMOCRACY?’,
thus lending itself to the unattainable goal, that from the ‘real world’.

These are just some basic technical options available when working
with images. Equally, the use of ‘screen dump’ and ‘snipping tool’, as I have
used throughout my blog, are important functions.
Moreover, continuing with technical features; images do not need
to be ‘static’ or ‘isolated’. The can form frames within a video, and support
audio, as I have shown in my basic video within blog post 4.3: http://hass-australian-curriclum.blogspot.com.au/2017/03/blog-post.html.
There are also a range of websites, where students can easily
create their own images. In this context, images are not merely, and don’t have
to be, photographs of events; the use of infographics and mind mapping are used more and more to
present information (especially within organisations, Government and business);
such as this infographic from the organisation ‘Mission Australia’, showing a
snapshot of their 2016 Youth Survey:

In designing pedagogy, it is important that use of images (visual literacy) is integrated with traditional literacies, such as reading, critical
reasoning and higher order thinking; drawing on images to optimise meaningful learning
for students. For example, a ‘topical’ and extremely contentious issue in South
Australia at the moment is the potential use of Nuclear Energy proposed by the
Premier; this has become rapidly magnified in the wake of the recent ‘energy
crises’ (that followed a recent State Wide Blackout), and leading into a State
Election imagery and messages about energy and nuclear are abundant.
Referencing this current ‘real’ nuclear debate through pedagogy, with
the use of imagery; embedding the SAMR model, I would propose students to
identify images that capture ‘nuclear’ in South Australia; such as:


Students would then ‘upload’ these images to their lesson blogs;
and describe what these images mean and say to them.
Exploring the issue further, students would then use google earth
and maps to identify the proposed locations of Nuclear in South Australia; as
well as using google images to identify other nuclear sites across the world;
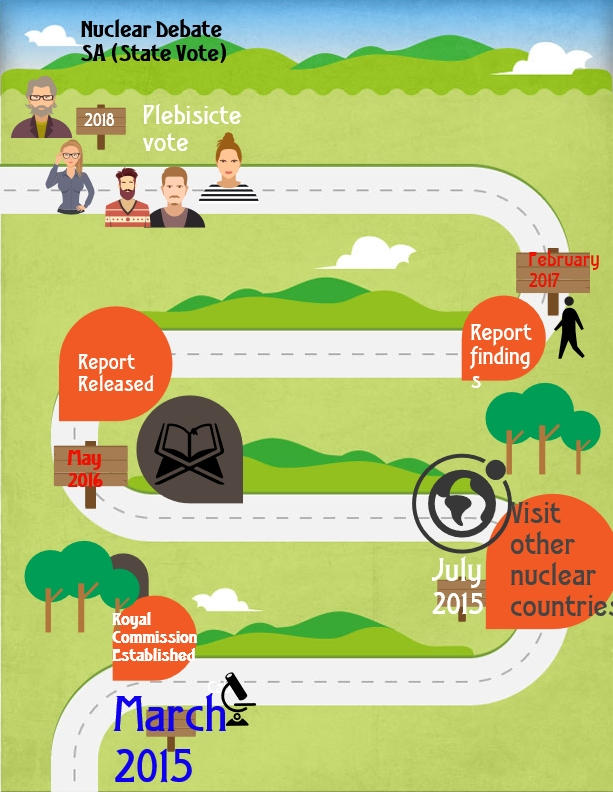
such as Switzerland and Finland. To embed and ensure higher order thinking, students
would then create an info graphic to present the process and timeline of the
State Vote (plebiscite) on Nuclear (once complete, this would then be uploaded
to their blogs): (such as this generated inforgraphic below)
References:
Australian Curriculum, Assessment and Reporting Authority (ACARA).
(2016) http://v7-5.australiancurriculum.edu.au/generalcapabilities/overview/general-capabilities-in-the-australian-curriculum
No comments:
Post a Comment